"The dollar is our currency, but it’s your problem," US Treasury Secretary John Connally told his G10 counterparts in 1971. Given the impact of US monetary policy on global markets, Janet Yellen or Jerome Powell might say much the same today. As the Federal Reserve increased interest rates from 0.25% in March of this year to 4% in November to tame inflation, the dollar’s appreciation is not only threatening debt sustainability in low- and middle-income countries; it is also exacerbating inflationary pressures in the rest of the world.
What drives inflation in the US and how the Federal Reserve will react are, therefore, key considerations for policymakers around the world. As discussed in our recent paper, real-time indicators (RTIs) can provide valuable insights beyond traditional statistics during fast-moving crises. While traditional statistics show that US inflation remains far above target levels, RTIs suggest it is in fact trending downwards.
How did we get here?
Since the COVID-19 pandemic, there have been three main drivers of inflation:
- Global COVID-19 lockdowns created severe supply constraints, some of which persist given China’s ‘zero-COVID’ policy.
- US government pandemic support and stimulus programmes, which sustained consumer demand.
- Russia’s invasion of Ukraine, which has sent the prices of key commodities such as wheat and gas soaring (although these have dropped recently, and the US as an oil and gas producer has been less affected than elsewhere).
This mix of demand-and-supply shocks matters because monetary policy largely affects only the demand side. Many of these factors are therefore beyond the Federal Reserve’s control. However, the worry is that this combination of shocks could shift inflation expectations upwards in a lasting way and fuel a self-sustaining inflationary spiral.
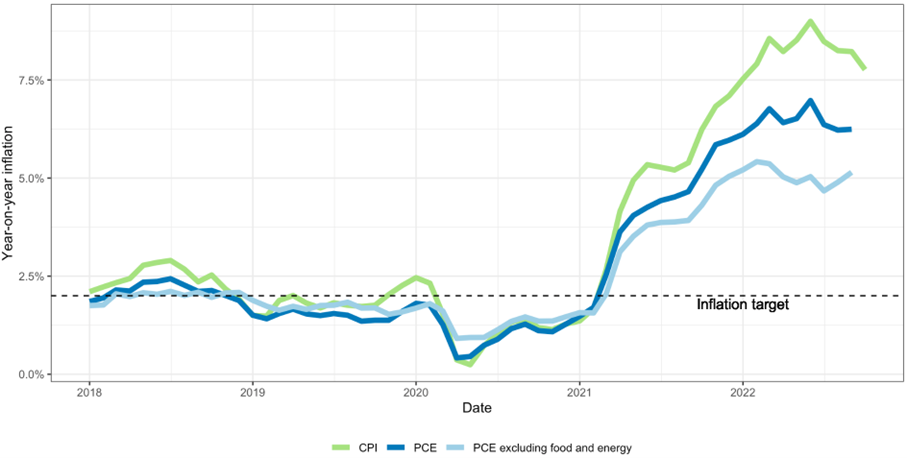
US inflation remains high. The consumer price index (CPI) was 7.7% in September, down from 9.0% in June, while the personal consumption expenditure (PCE) deflator – the Federal Reserve’s preferred measure for inflation – was 6.2%. Although the core PCE deflator (excluding food and energy prices) was only 5.1% and appears to have at least plateaued, the overall picture is an elevated rate of inflation, far in excess of the Federal Reserve’s 2% inflation target.
CPI and PCE deflators, 12-month growth rate, January 2018 to September (PCE) and October (CPI) 2022
Looking back: what has been driving inflation?
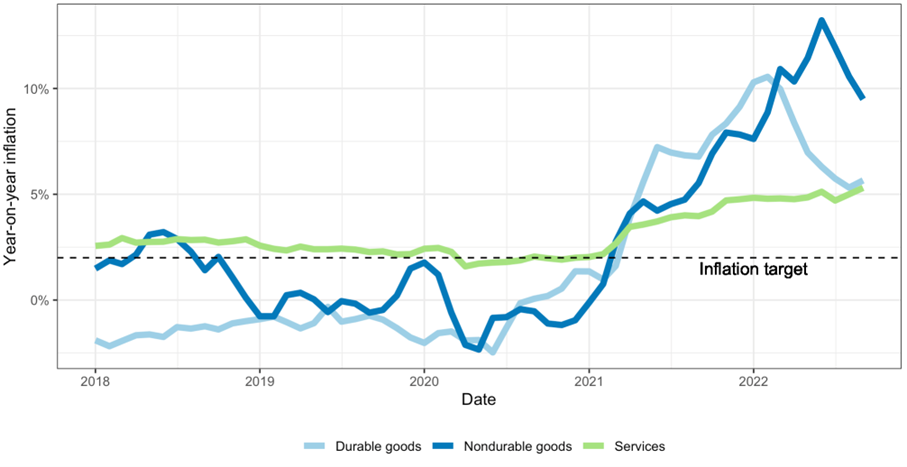
Looking back at the progressively changing make-up of inflation, a case can be made for a hawkish Federal Reserve. While the initial supply chain constraints, combined with sustained demand, drove up both durable and non-durable goods, services inflation has been on a steady rise, reaching 5.3% in September 2022.
PCE deflator by category, 12-month growth rate, January 2018 to September 2022
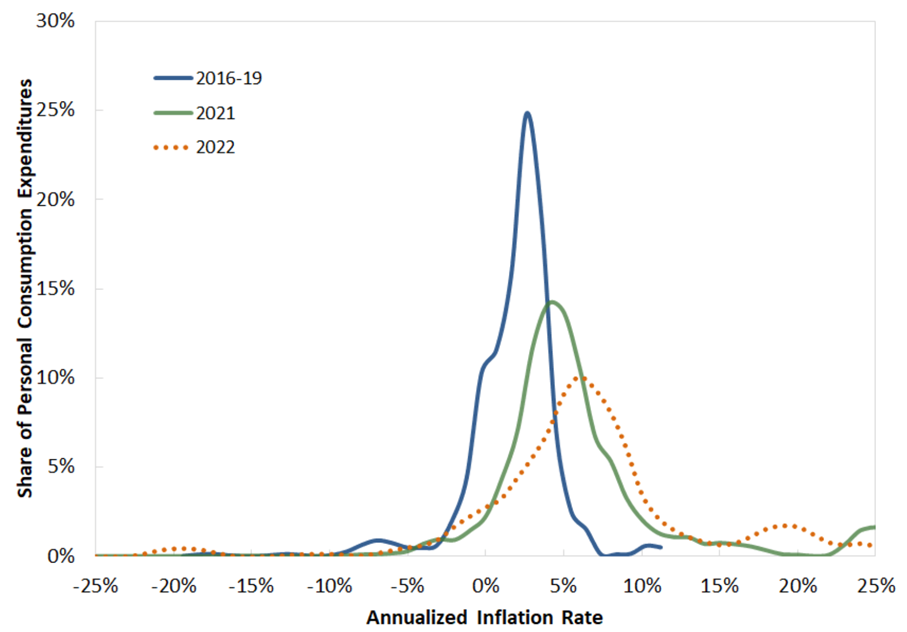
There are also concerns that these trends are not simply driven by one-off events and volatile items. Analysis by the St. Louis Federal Reserve found that inflation has been both higher and more dispersed in 2021 and 2022 than in the pre-pandemic years, suggesting that inflationary pressures are feeding through to an increasingly broad range of goods and services, which in turn could create a broad-based inflationary spiral.
Estimated distribution of annualised PCE inflation – specific COVID-19 years
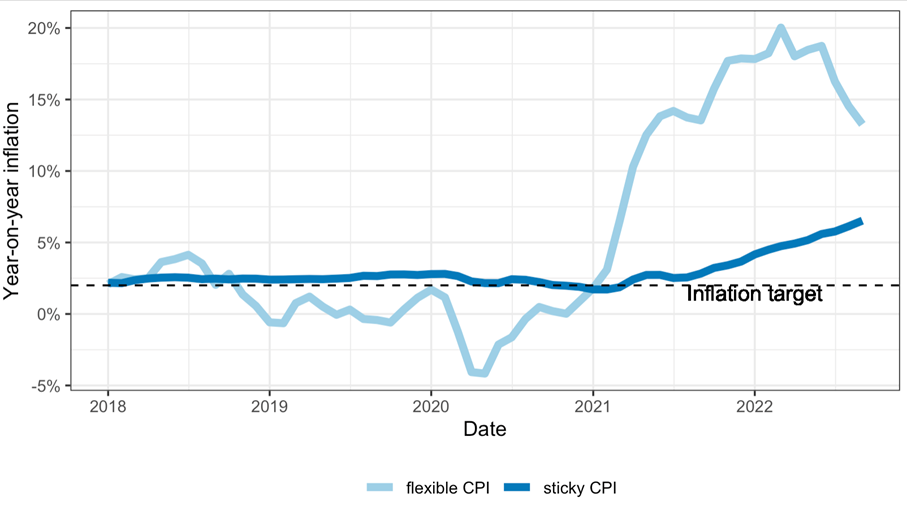
Another source of concern relates to price ‘stickiness’ – that is, prices that tend to change more slowly than others. The Atlanta Federal Reserve has helpfully produced a composite measure of CPI for such ‘sticky’ prices, which has been steadily rising since 2021 and reached 6.5% in September. This will also worry the Federal Reserve since these prices further reflect a persistent, rather than transitory, inflation that will feed into consumer expectations and potentially fuel a wage-price spiral.
Sticky vs flexible-price CPI, January 2018 to September 2022
Looking forward: what do RTIs tell us?
Looking forward using RTIs, we see a different story: one where longer-term drivers of inflation are abating, even if the impact has not yet been felt in official inflation data.
The disruptions linked to the differing timings of COVID-19 lockdowns and re-openings led to supply bottlenecks and surging shipping costs in 2020 and 2021. However, these have dropped steadily since the start of 2022 (although they still remain above the pre-pandemic average). IMF research found that shipping cost increases feed through to inflation for up to 18 months. This suggests that the supply chain shock is still working its way through to inflation. Nevertheless, this pressure may start to reverse in the coming months.
Freightos Baltic Index (FBX) Global Container Freight Index, January 2018 to October 2022
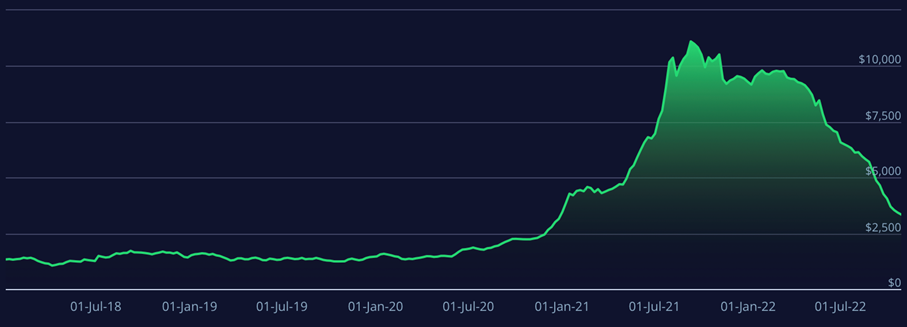
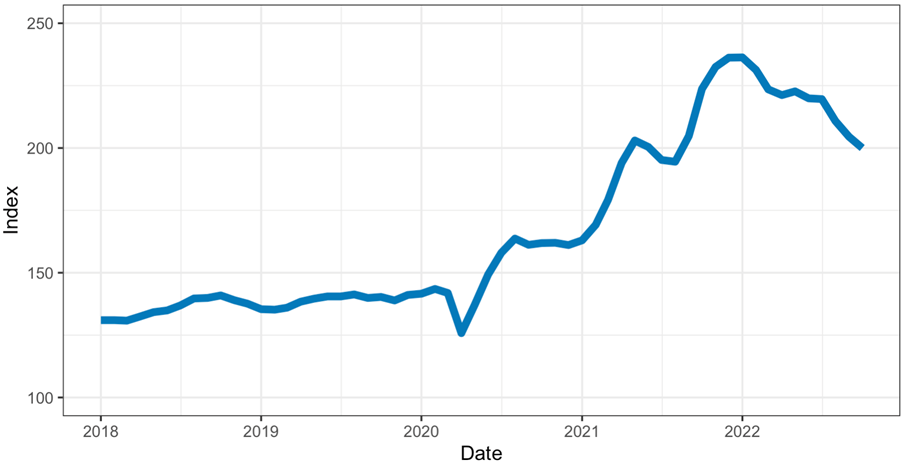
The COVID-19 supply chain disruptions caused shortages of microchips for new cars, which in turn led to a rapid increase in second-hand car prices. The Manheim Used Vehicle Value Index, which became a bellwether for supply chain bottlenecks in manufacturing, has been on a downward trend since January 2022, offering hope that this will eventually push down inflation.
Manheim Used Vehicle Value Index, January 2018 to October 2022
As inflation starts to reduce consumers’ purchasing power, workers have started negotiating pay rises. The Atlanta Federal Reserve’s Wage Growth Tracker has shown that the three-month moving average of median wage growth has increased to more than 6% (although there are tentative signs it may have peaked), while unemployment is as low as 3.5%. These will cause concern for the Federal Reserve if they become drivers of future inflation.
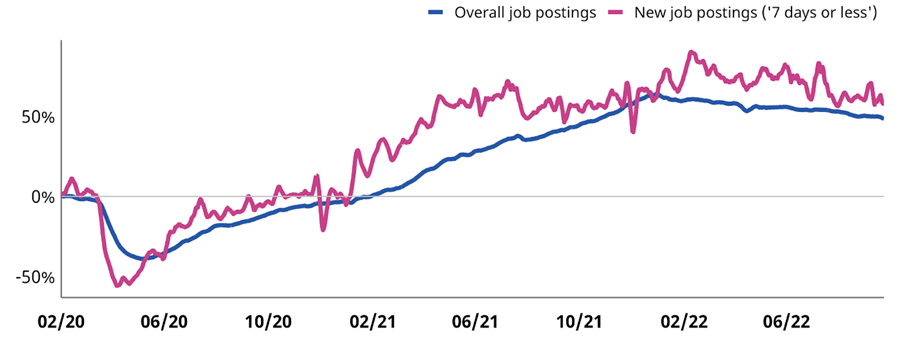
On the other hand, RTIs produced by Indeed, the online job vacancy portal, reported a slow but steady downward trend in vacancies since the start of the year. This suggests labour markets are cooling down to some extent, although they are still significantly higher than pre-pandemic levels.
Job postings on Indeed, United States (percentage change in job postings since 1 February 2020, seasonally adjusted, to 23 September 2022)
Finally, housing services – which make up 15% of the PCE and have been a key driver of services inflation – have taken centre stage in the debate surrounding the persistence of inflation.
Economists such as Paul Krugman have recently pointed out that RTIs from online listings can provide a better picture of future price moves. This is because official statistics reflect the (slower-moving) stock of current rentals, while online listings are a flow of new rental agreements and may better reflect future movements in overall rental prices.
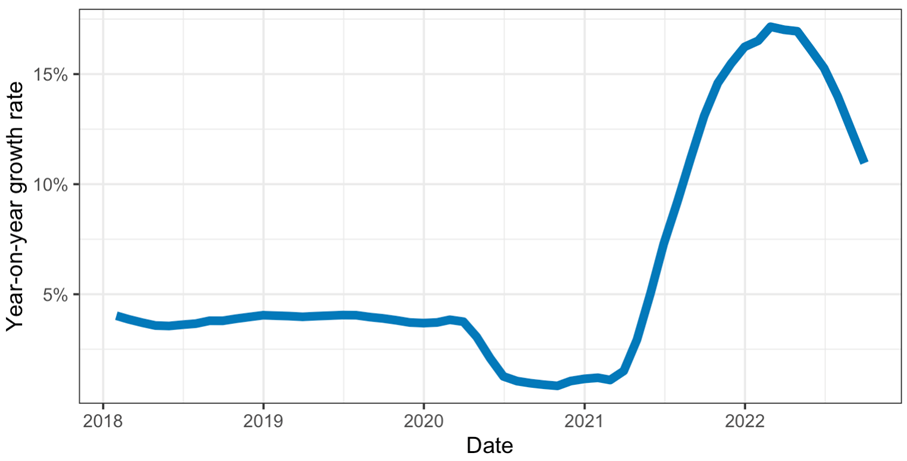
The Zillow Observed Rent Index (ZORI) peaked at 17% in early 2022 but has since sharply decreased to just over 10%. This means that while housing services are likely to put upward pressure on prices for some time still, this should reverse in the longer term if the current trend persists.
ZORI, January 2018 to September 2022
Where next?
In his latest press conference, Jerome Powell said that while the pace of interest rate increases may slow "as soon as the next meeting, or the one after that," they were clearly not yet at an inflexion point. The pace of tightening is dependent on balancing increasingly contrasting insights from backward- and forward-looking indicators, raising risks for low-income countries at the receiving end of the US dollar’s appreciation. Officials across the world would do well to look beyond traditional statistics and include RTIs in their toolkits in order to navigate the economic uncertainty.
